Pasta production in the E.U. in tonnes (2013-2022)
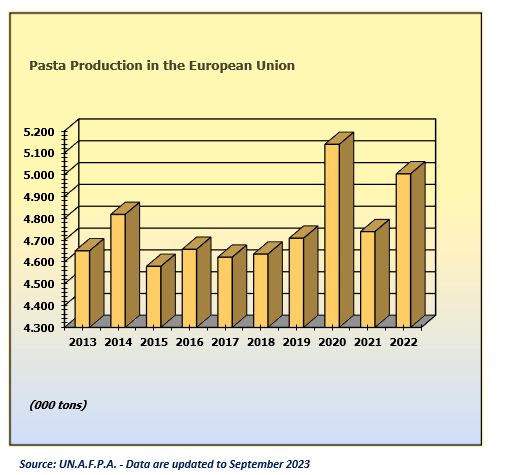
2013-2014-2015 - Data include: Czech Republic, France, Germany (2011), Greece, Italy, Netherlands (2010), Portugal, Spain, Sweden (2005) and the United Kingdom (2012).
2016-2017-2018 - Data include: Czech Republic, France, Germany (2011), Greece, Italy, Netherlands (2010), Portugal, Spain, Sweden (2005) and the United Kingdom (2012).
2019 - Data include: Belgium (2014), Czech Republic (2015), France, Germany (2011), Greece, Italy, Netherlands (2010), Portugal, Spain, Sweden (2005) and the United Kingdom (2012).
2020 - Data include: Belgium (2014), Czech Republic (2015), France, Germany (2019), Greece, Italy, Netherlands (2010), Portugal (2017), Spain (2020), Sweden (2005) and the United Kingdom (2012).
2021 - Data include: Belgium (2014), Czech Republic (2015), France, Germany (2019), Greece, Italy, Netherlands (2010), Portugal (2017), Spain (2020), Sweden (2005) and the United Kingdom (2012).
2022 - Data include: Belgium (2014), Czech Republic (2015), France, Germany (2019), Greece, Italy, Netherlands (2010), Portugal (2017), Spain (2020), Sweden (2005) and the United Kingdom (2012).